Art teachers know their work matters—but showing that impact in a way others understand can be a challenge. With a few small shifts in how you document artistic discovery, you can turn everyday moments into clear and compelling evidence of student growth. You’re already doing the work, so why not ensure it gets noticed by others and propels positive change for your program?
Share your powerful art room stories through a simple data collection process.
Data is often a dreaded word in the art room—but it doesn’t have to be! You probably already use multiple kinds of data every day and don’t even realize it. With a little documentation, you can turn your daily magical moments of student growth into powerful stories to grow your program and the field of art education at large. A data mindset also comes in handy when applying for grants, setting and tracking goals at the beginning of the school year, and for district-appointed Professional Learning Communities (PLCs).
Art teachers are already masters of collecting data in many different ways, such as:
1. Identify and break down one standard.
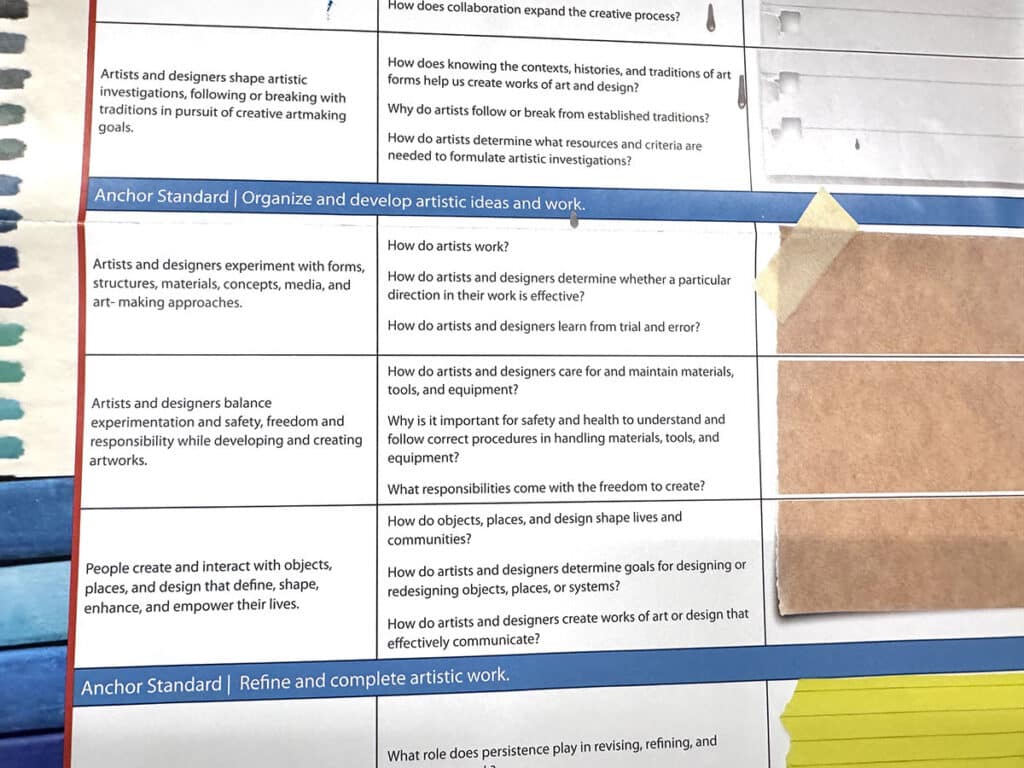
The National Core Arts Standards (NCAS) serve as a universal language in education and are a great starting point for collecting your data. There are four sections (Creating, Presenting, Responding, and Connecting), and you can easily adapt them to existing lessons and units. Linking what you already teach to the NCAS will help you use data to tell a story of student achievement with concrete evidence.
Although the NCAS is fantastic for your teaching, its wording is often dense and heavy. They are not intuitive for students to comprehend. Breaking them into bite-sized chunks will help with your lesson planning, communication with students, and data collection. Once you select your focus standard, involve students in a conversation to simplify the wording and define key terms. Have them rewrite the standard in their own words as a quick exit ticket to check for understanding.
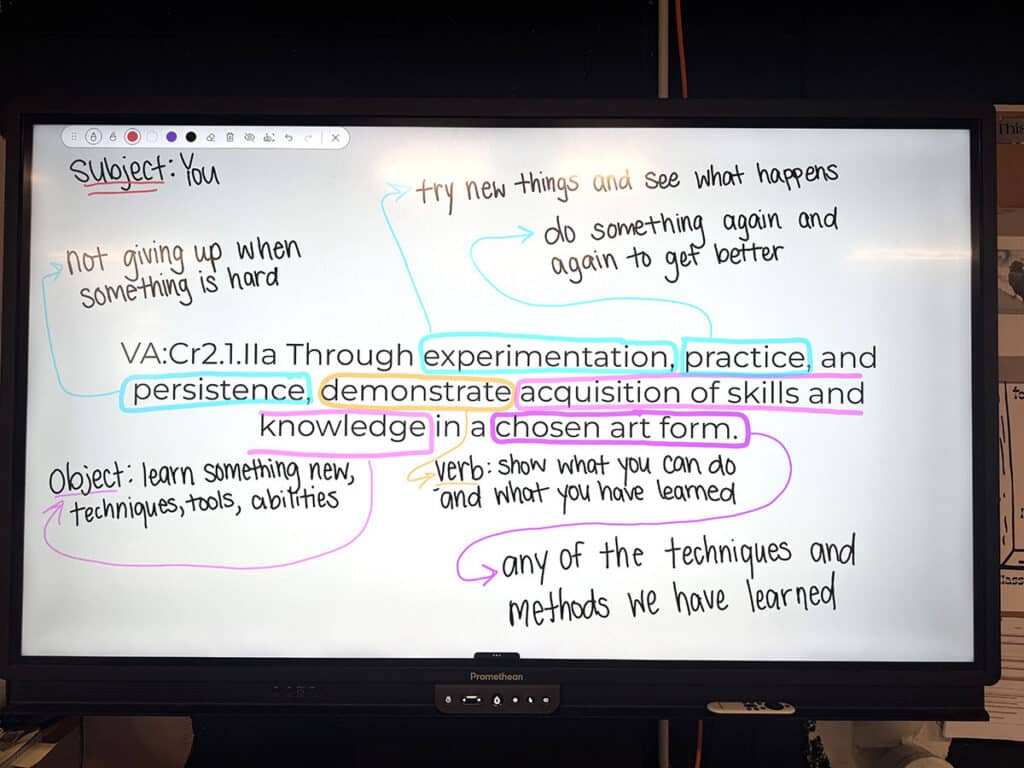
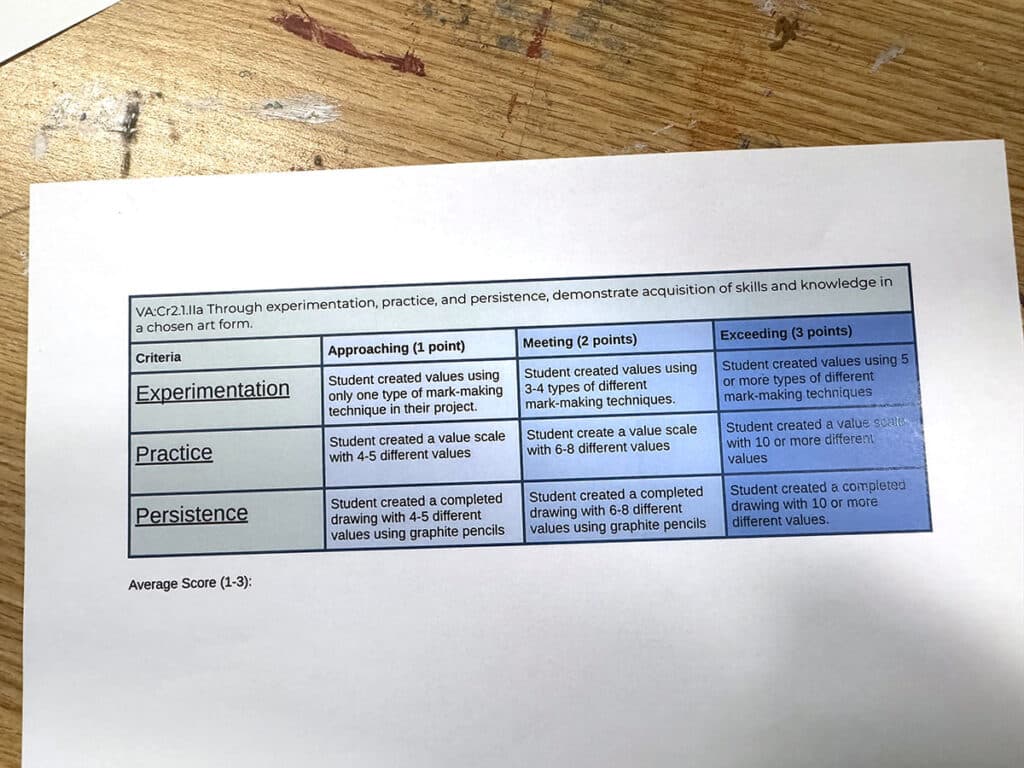
Let’s focus on this standard:
- VA:Cr2.1.IIa: Through experimentation, practice, and persistence, demonstrate acquisition of skills and knowledge in a chosen art form.
Break the standard down into the following building blocks:
- Subject: You
- Verb: Demonstrate
- Object: Acquisition of skills and knowledge
- Descriptors: Experimentation, practice, and persistence
Define any key words, such as:
- You: The students.
- Experimentation: Trying new things to see what happens.
- Practice: Doing something repeatedly to get better at it.
- Persistence: Not giving up when something is hard.
- Demonstrate: Show what you can do and what you learned.
- Acquisition: Learning something new.
- Skills and Knowledge: Techniques, tools, and abilities.
- Chosen Art Form: Any of the techniques and methods already learned, but in this case, graphite drawings.
2. Collect qualitative data.
Qualitative data are words and images, and in the art room, they usually focus on creative thinking and student voice. Examples of qualitative data are finished works of art, artist statements, experimentation sketches, or process pages. But what does this look like in the context of a standard?
For a graphite drawing using the standard above, qualitative data can look like:
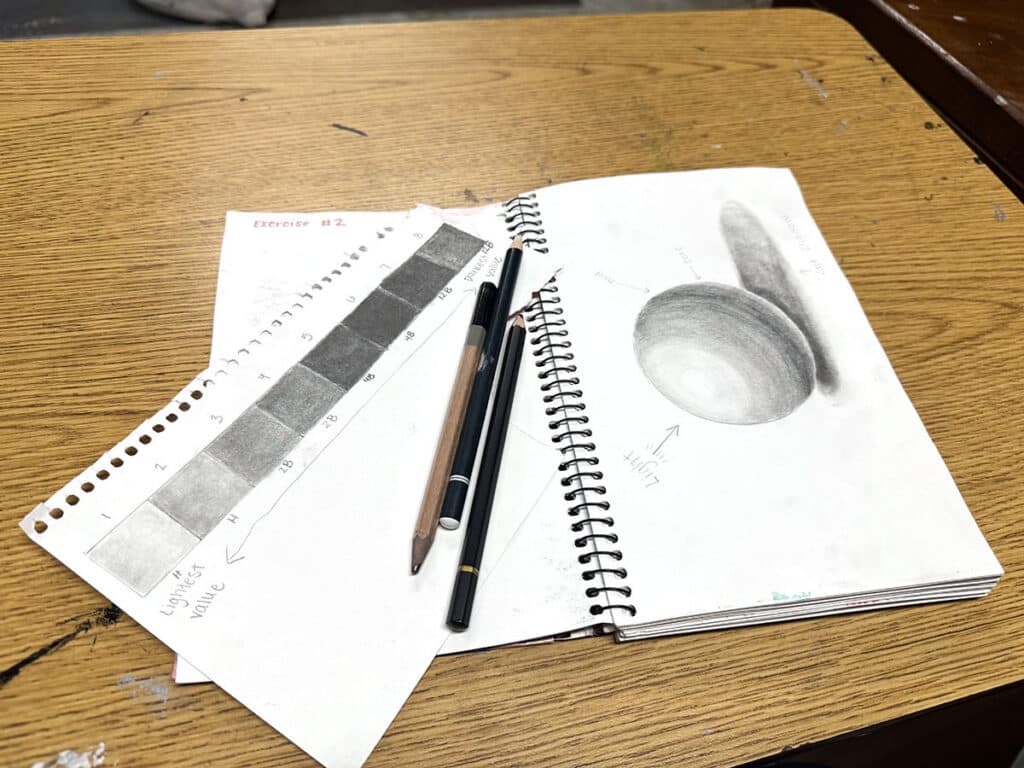
- Experimentation: Create value scales with a variety of different mark-making techniques and graphite pencils.
- Practice: Compose a quick abstract design with gradients within each shape.
- Persistence: Shading a more challenging object from life with high contrast.
- Acquisition: Completing a final graphite drawing that demonstrates a range of values to create depth.
One way we guide students through words and images is with prompts. Take the breakdown of your standard and use it to generate meaningful sentence stems or reflection questions. The written products provide excellent qualitative evidence of learning tied to the standard. Students can also take photos of their finished drawings and add their writing to an annotated slide deck in a digital portfolio.
Evaluating this standard with a graphite drawing lesson, you can ask:
- Experimentation: What was one new skill you tried for this project?
- Practice: What did you have to do again and again in order to get better?
- Persistence: What challenge did you face while working, and how did you overcome it?
- Acquisition: Explain how your final drawing shows the skills and knowledge you learned.
3. Track quantitative data.
Quantitative data is numerical and answers questions like: How much? Or how many? This data is best for tracking student progress over time and for showing big-picture trends. There are quite a lot of numbers in art, believe it or not—you just need to look for them. Plus, it’s always interesting to have fun stats! Start counting days, students, tools, and more, and record them in a running doc. You can always pull them later to include in your story to support hard-to-measure elements, such as feelings of persistence or aesthetic concepts.
For a graphite drawing lesson, track the following numbers:
- How many students are in your class?
- How many classes/minutes did it take to complete the lesson/standard?
- How many different kinds of graphite pencils did you provide?
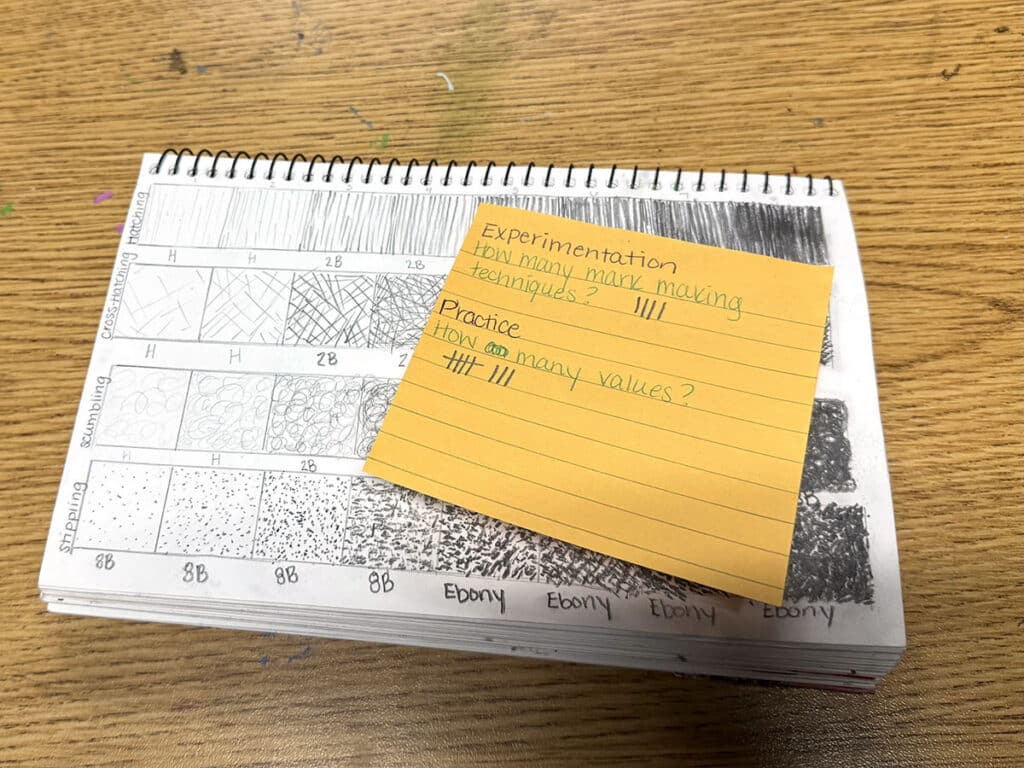
- How many value scales did students generate?
- How many students were absent during the lesson/standard?
- How many sketchbook pages did students fill with experimentation?
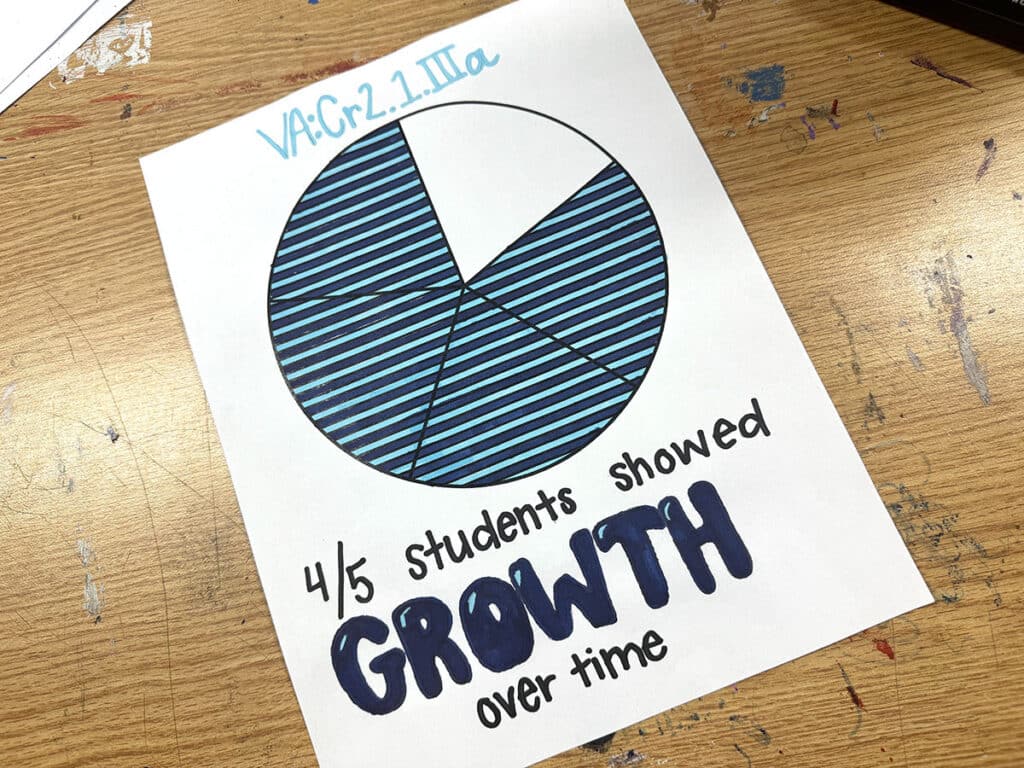
4. Use your qualitative data to generate quantitative data.
Another way to get quantitative data is to add numeric values to your rubrics. If you have a rubric that breaks proficiency down into Approaching, Meeting, or Exceeding, assign points to each. Just be sure to include specific expectations so it’s clear what criteria you’re assessing. If you have a solid rubric like the Plug n’ Play Rubric from FLEX Curriculum, you can reuse it with each lesson or unit and quickly customize the expectations. A consistent rubric will also show student growth over an entire quarter, semester, or year.
Let the data do the talking!
Words, numbers, and pictures tell a powerful data story for those who are not present in your art room every day. Speaking the language of data enables you to communicate your students’ growth to a variety of audiences in a way they can grasp. Start small: track one class through one standard in one lesson. Keep your data organized so you’re ready when an administrator asks for an artifact, you need to advocate to keep a course running, or you’re applying for a grant. By taking control of your data, you strengthen your voice as an art educator and position your program for greater recognition, support, and success.
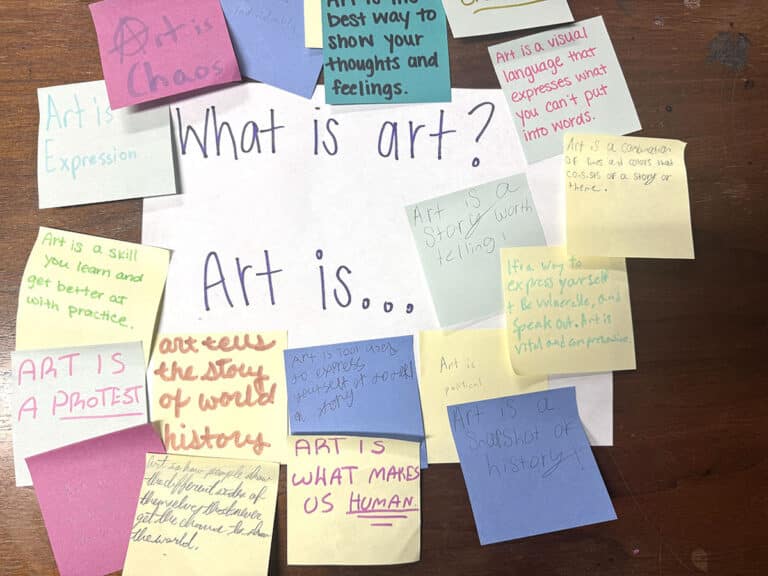
How do you use standards in your art room with students?
Why is it important for art teachers to speak the language of data?
To chat about data collection with other art teachers, join us in The Art of Ed Community!
Magazine articles and podcasts are opinions of professional education contributors and do not necessarily represent the position of the Art of Education University (AOEU) or its academic offerings. Contributors use terms in the way they are most often talked about in the scope of their educational experiences.